What is Usage
Usage provides an overview of GoInsight.AI activity across your organization. It helps administrators track usage by department, group, and individual member.
From this page, administrators can track AI usage across the organization through key metrics: user adoption, execution quality, resource consumption, leaderboards, and historical trends.
Filtering
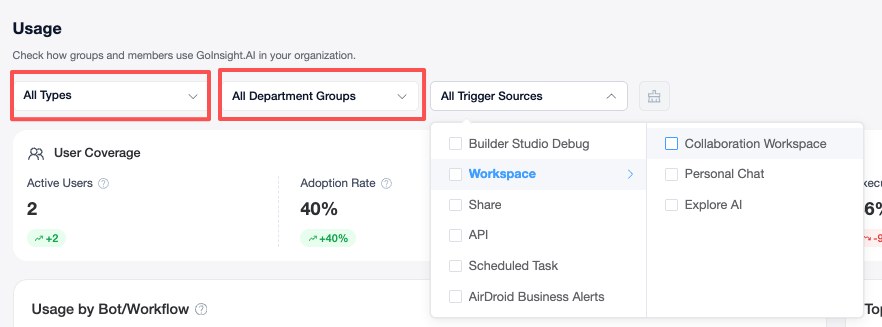
Multiple filtering criteria are provided at the top of the page, allowing administrators to view Usage within different scopes as needed.
Supported filtering criteria include:
- Type: View data by different resource types, such as Quick Bot, Interactive Flow, Service Flow, Cloud-Side Tool, Agent Strategy, etc.
- Department / Group: Select all departments and groups, or filter by specific departments or groups.
- Trigger Source: View data by different sources, such as Workspace, Share, API, Scheduled Task, etc.
- Time Range: Choose a specific date range, or quickly switch to Today, This Week, or This Month.
The filtering criteria affect the overview data, rankings, and trend charts on the page, helping administrators analyze usage from different perspectives.
Core Data Overview
The top of the page displays the core metrics under the current filter conditions, including:
User Coverage
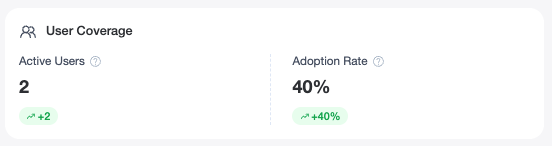
Used to view user usage within the current scope, including:
- Active Users: The actual number of enterprise users who have logged into the platform and manually successfully triggered at least one AI application run.
- Penetration Rate: The percentage of active users out of the total number of platform accounts assigned within the enterprise, reflecting the actual penetration level of AI tools inside the enterprise.
Execution Quality
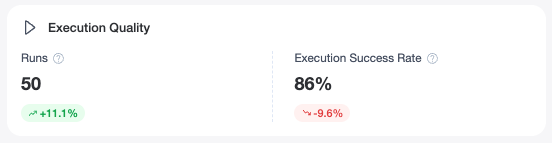
Used to view the running status of workflows, bots, or related capabilities, including:
- Run Count: The total number of times all AI assets (Quick Bot, various workflows, tools, and Agent) have been triggered to run under the filter conditions, including both official runs and debug records.
- Run Success Rate: The proportion of initiated run actions (including manual and scheduled tasks) that completed fully without system-level exceptions (such as timeouts or errors).
Resource Consumption
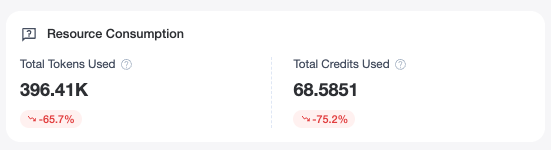
Used to view the resource consumption generated during the use of GoInsight.AI, including:
- Total Token Consumption: The sum of input (Prompt) and output (Completion) Token consumption generated when all AI assets (Quick Bot, various workflows, tools, and Agent) invoke large AI models under the filter conditions.
- Total Points Consumed: The total platform points actually deducted due to running various AI assets (such as model inference, tool calls, etc.), reflecting the actual cost expenditure.
These metrics help administrators quickly assess the overall usage scale, operational stability, and resource consumption of GoInsight.AI within the enterprise.
Ranking Data
The Usage page provides multiple rankings for viewing the usage of different objects.
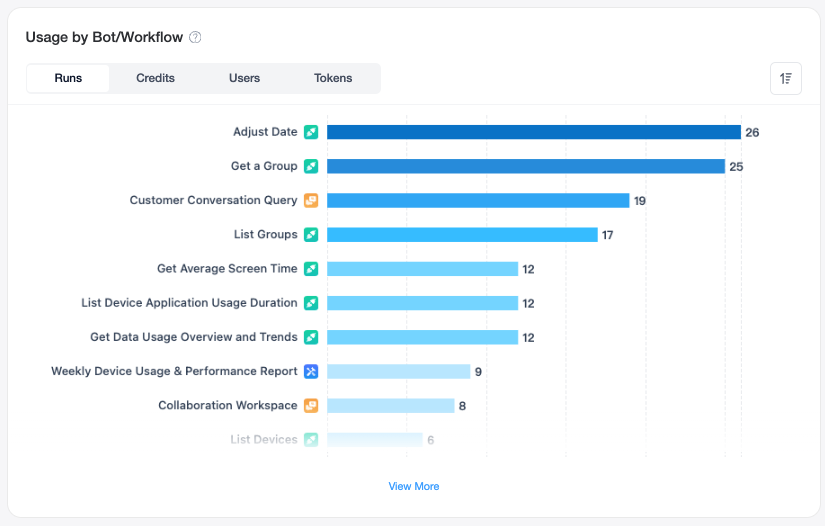
Usage by Bot/Workflow
This ranking displays the usage and consumption ranking of each AI asset under the current filter conditions.
If a workflow calls downstream workflows, Tools, or Agents during its execution, the called downstream objects are also counted as independent AI assets in the ranking. Consumption is counted as full consumption, including the asset itself and the consumption generated by its downstream calls.
Supports switching between the following statistical dimensions:
- Run count
- Point consumption
- Number of users
- Token consumption
Administrators can use this ranking to understand which workflows or bots are used more or consume more resources.
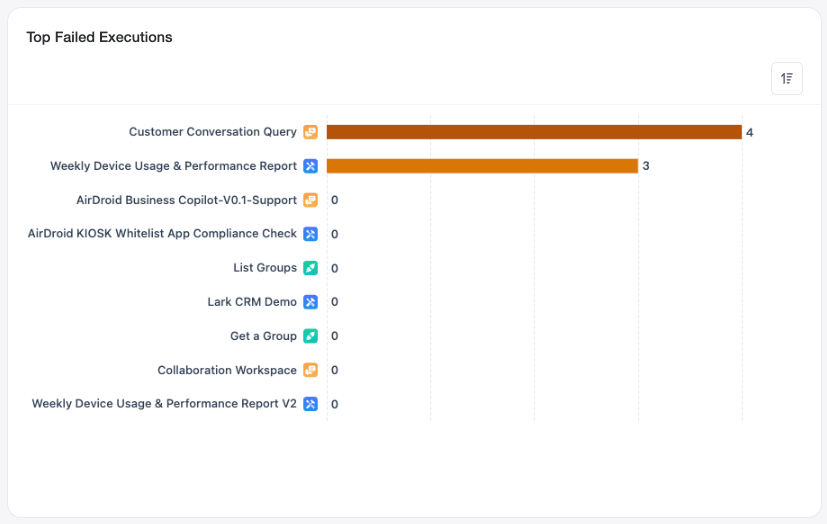
Top Failed Executions
This ranking is used to view workflows or bots with a high number of run failures.
Administrators can quickly identify objects with frequent run failures and further check configurations, permissions, interfaces, or other operational issues.
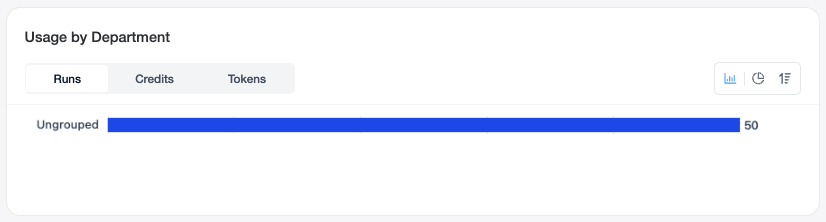
Usage by Department
This ranking is used to view the usage and consumption of different departments or groups.
It supports viewing by run count, point consumption, Token consumption, and other dimensions, helping administrators understand usage differences among different departments or groups.
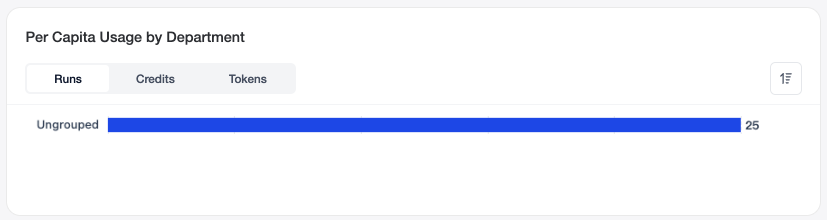
Per Capita Usage by Department
This ranking is used to view the per capita usage within different departments or groups.
This data is suitable for observing the intensity of per capita usage within a department, avoiding the influence of differences in department headcount when only looking at total consumption.
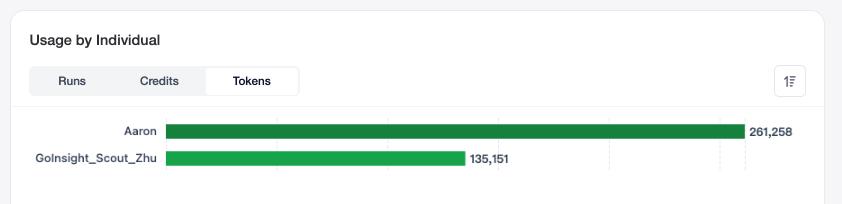
Usage by Individual
This ranking is used to view usage at the individual member level.
Administrators can understand the usage of GoInsight.AI by different members based on run count, point consumption, or Token consumption.
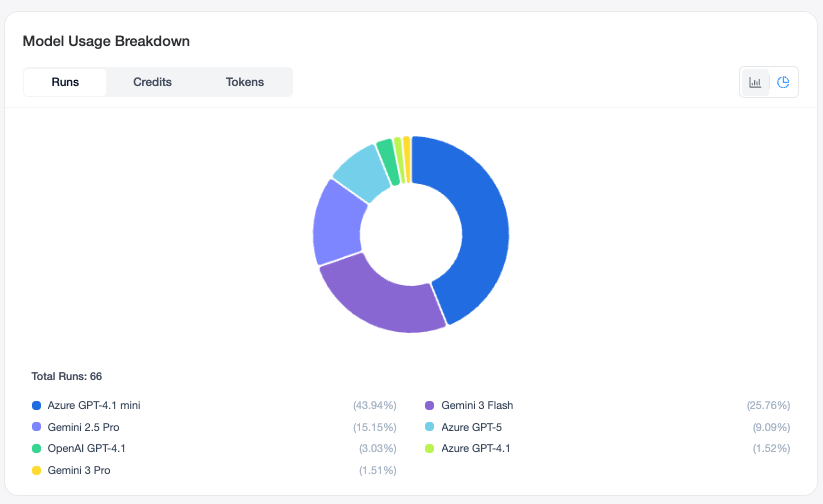
Model Usage Breakdown
Model Usage Breakdown is used to view the usage proportion of different models within the current filter range.
Administrators can use this chart to understand which models are mainly used within the enterprise, and the proportion of different models in run count, point consumption, or Token consumption.
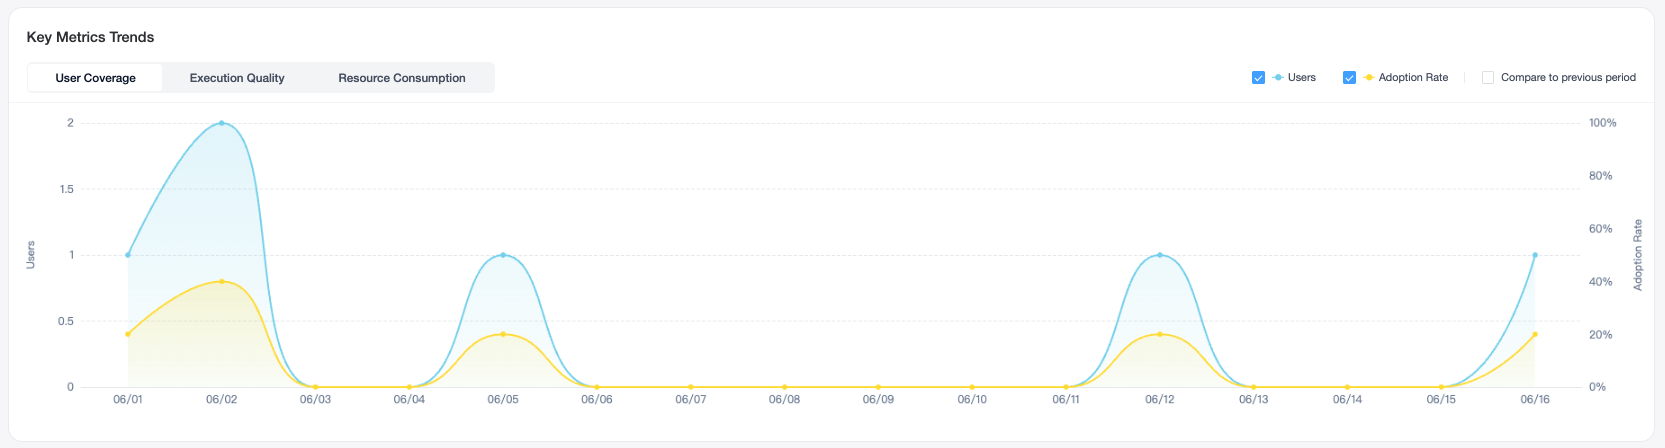
Key Metrics Trends
At the bottom of the page, the "Key Metrics Trends" chart is provided to view the changes of key metrics on different dates.
The metrics available for viewing include:
- User Coverage
- Running Quality
- Resource Consumption
Under the Resource Consumption dimension, trend changes such as total points consumed and total token consumption can be viewed.
Administrators can use the trend chart to observe whether enterprise usage is growing steadily or shows noticeable fluctuations on certain dates.
Platform Overview on the Right Side
The right side of the page provides an overall overview of the platform, including:
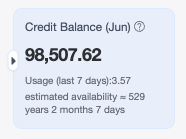
Credit Balance
Displays the credit balance for the current month, recent consumption, and the estimated available time.
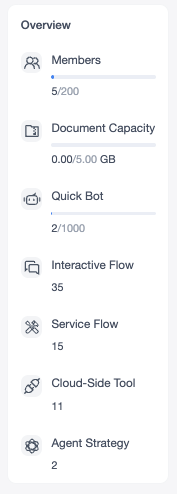
Overview
Displays the quantity of some resources within the current platform, such as:
- Members
- Document capacity
- Quick Bot
- Interactive Flow
- Service Flow
- Cloud-Side Tool
- Agent Strategy
This area is used to help administrators quickly understand the resource usage and configuration status of the current enterprise account.
Access Permission
The "Usage" report is only visible to members with Department Head permissions or above. Different roles can view different scopes of data:
- Department Head: Can only view Usage within the department they are responsible for.
- Enterprise Owner / Super Administrator: Can view Usage across the entire organization.
Therefore, the scope of data displayed on the page will be automatically limited according to the current user's role permissions.


Leave a Reply.