GoInsight.AI offers a "Usage" statistics feature that enables administrators to view multi-dimensional usage data of GoInsight.AI within the organization, clearly illustrating how AI is applied across the enterprise.
This feature also establishes an auditable AI environment by providing detailed statistics that can be broken down to the member or group level, and can even track daily Token usage precisely.
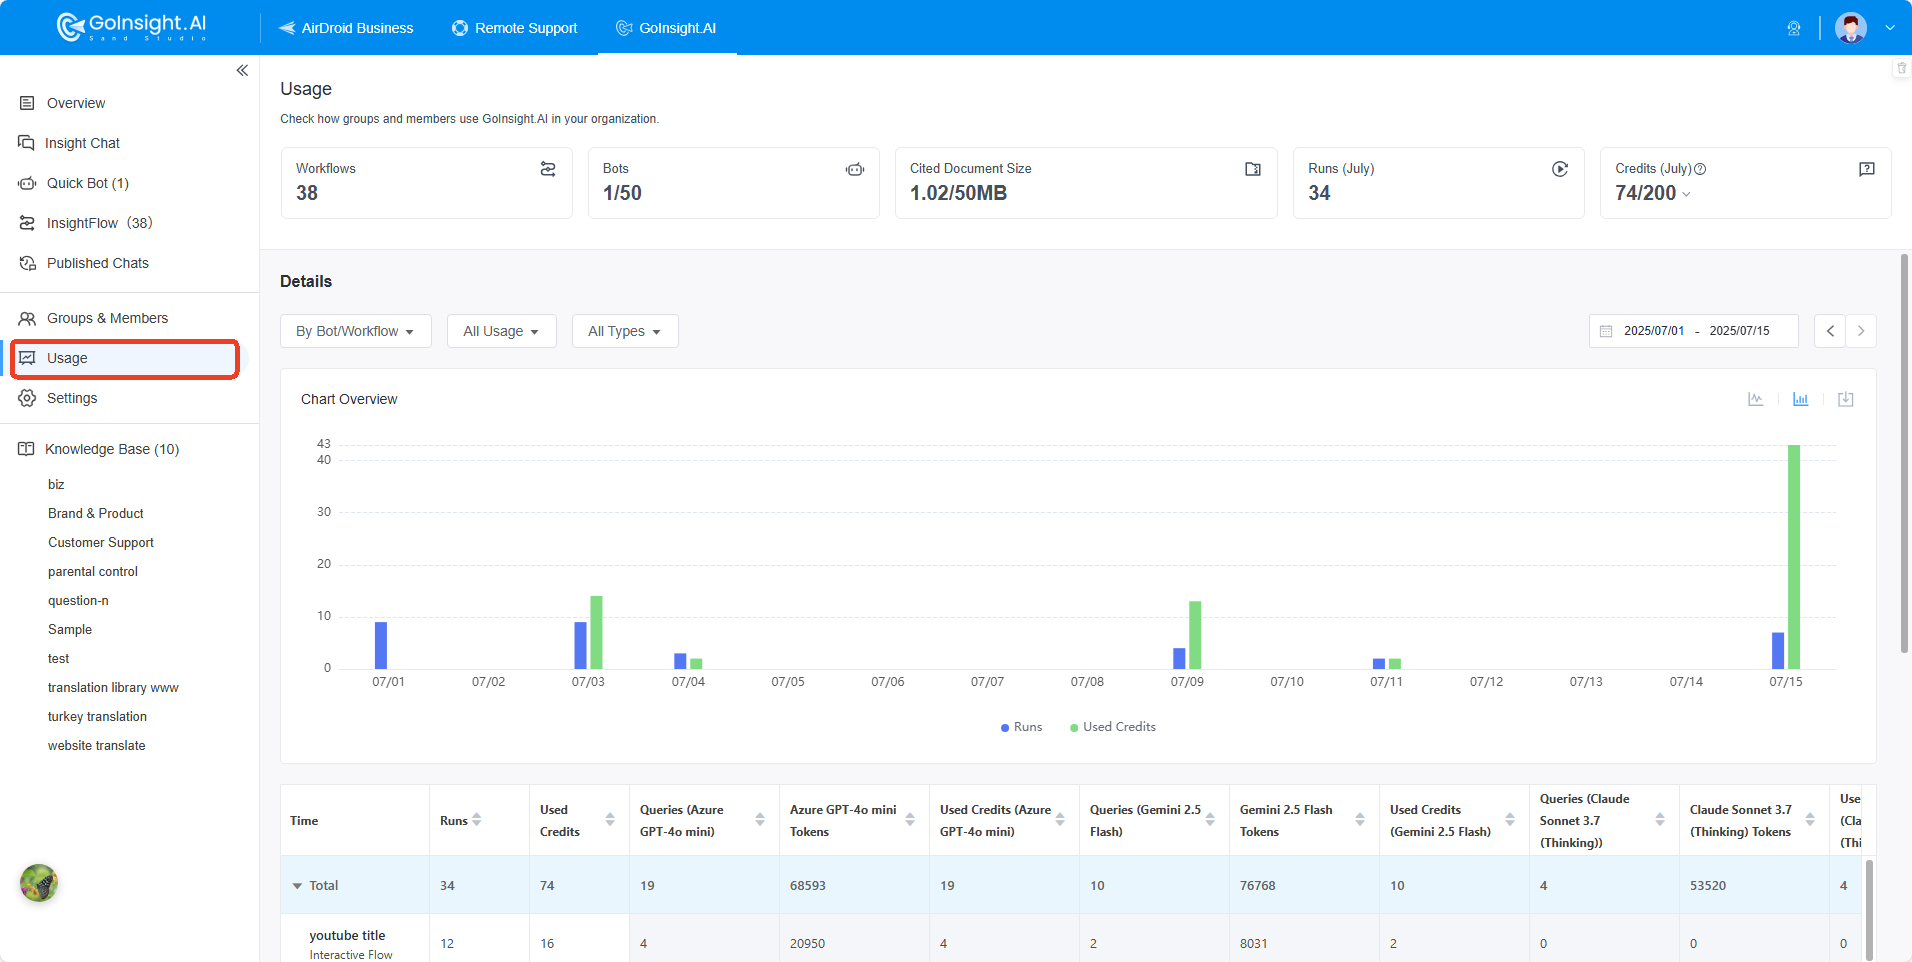
Usage Overview
At the top of the "Usage" page, an overview presents five key aspects of enterprise usage of GoInsight.AI:
- Workflows: Current InsightFlow count
- Bots: Current count / Maximum limit
- Cited Document Size: Current size / Maximum limit
- Runs: Includes the run counts for Quick Bots and InsightFlows (including debugging), but does not include the run counts of System Tools
- Remaining Credits: View the remaining credits and the total usage of this month. If your credits run out, quick bots and workflows will pause
With this overview, administrators can swiftly assess the construction and utilization of workflows and bots within the organization, the state of the knowledge base, as well as Credits consumption. If administrators wish to delve into detailed data, they can do so through the "Details" module.
Detailed Data
In the "Details" section, administrators can review the latest three months of usage details for GoInsight.AI. The time selection tool on the right allows for flexible query time selection. Detailed granular query options are available here, enabling accuracy down to the individual or specific workflows, whether they are in debugging or formal use.
Our analytics dashboard offers three primary ways to view your usage data within your organizaiton:
By Bot/Workflow
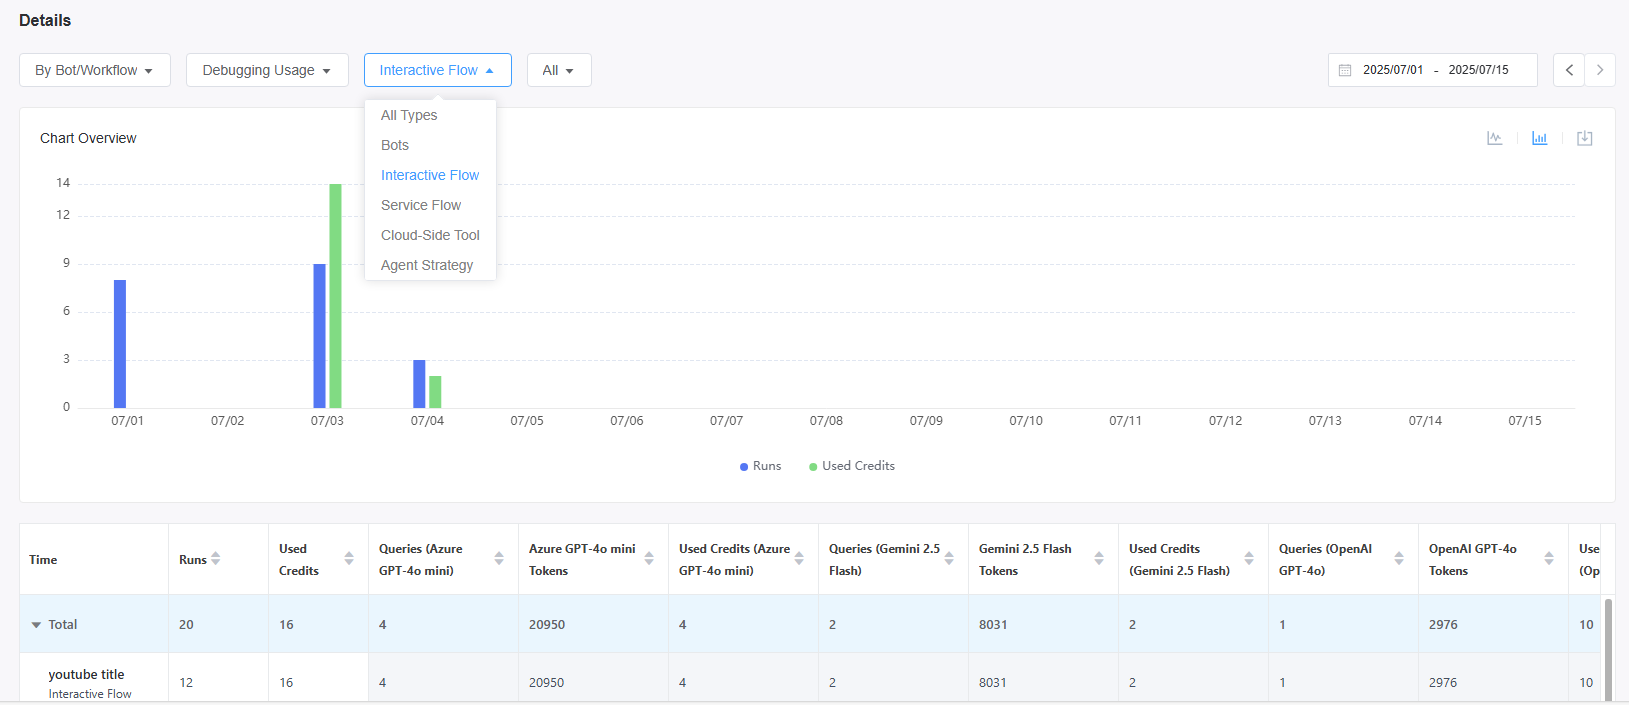
- Shows metrics grouped by each bot or workflow in your system.
- Ideal for understanding performance of specific automations.
- Includes production vs. debugging usage statistics.
- Breaks down usage by bot type (Interactive Flow, Service Flow, etc.).
By Group/Member
- Displays data organized by team groups or individual members.
- Helps track user activity and adoption rates.
- Shows which teams/people are most active with the bots.
- Allows filtering between all members or specific groups.
By System Tools
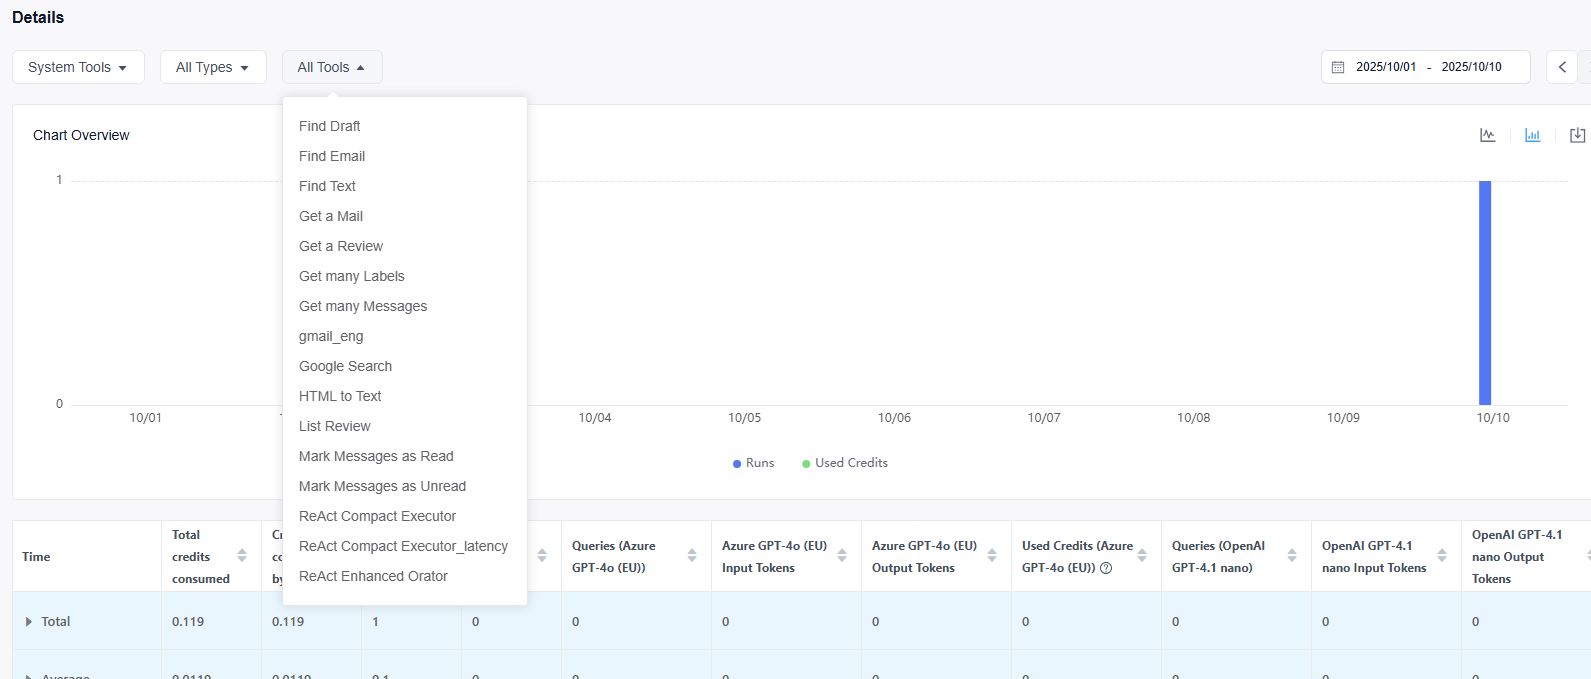
- Use the 'All Types' dropdown to choose between viewing 'All Types', 'Paid Tools', or 'Free Tools'.
- Use the 'All Tools' dropdown to either see a summary for all tools or select one specific tool to analyze.
- Supports filtering of data generated by intelligent Agent Strategies.
Leave a Reply.