Measuring AI Value, ROI & Governance
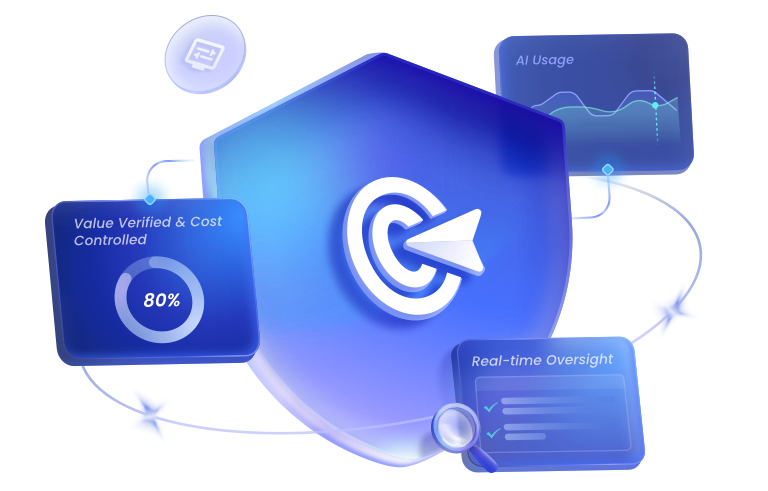
As AI becomes more integrated into daily work, organizations now focus on the actual business value it delivers, not just its use as a tool. To measure AI value and ensure governance, a three-layer operating model, including visibility (what's being used), accountability (where cost is coming from), and governance (what's allowed and traceable), is what organizations need. This page details how GoInsight captures measurable usage signals and applies practical guardrails, enabling managers to evaluate adoption, cost, and risk within a structured framework:
Layer 1: AI Value & ROI. What AI capabilities are being used, and where value is emerging across teams.
Layer 2: Cost & Consumption Breakdown. Where token consumption and execution cost come from, attributed by department, user, and workflow for budgeting and internal reporting.
Layer 3: AI Usage Governance. What usage is allowed, enforced through permissions and approvals, and made traceable through auditability.
The Visibility Layer: AI Value & ROI
Enterprise AI governance begins with observability. This layer focuses on adoption and value signals across teams: adoption inventory, usage hotspots, ROI signals (execution volume), and reliability trends. Together, these signals provide a baseline for evaluation—what to scale, what to fix, and where to focus enablement.
- Adoption Inventory
- Usage Hotspots
- ROI Signals
- Reliability Trends
AI Value comes from active usage, not just access. This dashboard provides a baseline view of members, knowledge bases, and workflows, so managers can distinguish between tool availability and work actually being carried through AI-enabled processes.
- Members: Gauge the scale of your AI-enabled workforce by tracking authorized users active in daily workflows.
- Knowledge Base Capacity: Measure the volume of internal context currently connected and active for AI retrieval.
- Workflows: Inventory the executable assets built for the enterprise, distinguishing between backend Service Flows and frontend Interactive Flows.
- Quick Bots: Track the proliferation of lightweight and task-specific assistants.
To scale from pilot to enterprise-wide use, companies must understand usage concentration. Usage Hotspots visualizes where adoption clusters across teams, individuals, and flows, helping managers identify high-value patterns and decide which workflows are worth replicating.
- Usage by Department: Identify teams where AI and automation are already integrated into daily operations.
- Usage by Member: Pinpoint high-frequency users who are driving early adoption.
- Top Use Cases (Bots/Flows): Isolate the most executed workflows to decide what to harden, document, and promote for broader reuse.
- Adoption Depth (Planned): Use active usage metrics (DAU/MAU) to distinguish accounts provisioned from habits formed.
- Builder Champions (Planned): Surface high-leverage creators. Identify builders whose outputs are repeatedly used by others to prioritize reusable assets.
ROI signals begin with workload replacement, not just activity. Execution volume is most meaningful when it reflects real operational load. This view quantifies the tangible shift from manual labor to automated scale.
- Usage by Bot/Workflow: Verify which automations are effectively handling high-volume, recurring tasks.
- Member Usage per Workflow (Planned): Distinguish between isolated personal usage and workflows that have become shared operational standards.
- ROI Estimation (Planned): Combine execution counts with Average Handling Time (AHT) assumptions to estimate total hours of manual labor replaced by automation.
- Personal Efficiency Insights (Planned): Identify employees who have genuinely shortened process loops, rather than simply ranking users by raw activity.
Reliability trends influence the pace of scaling. Unstable automation creates technical debt instead of value. This view audits operational health so teams can refine workflows before expanding usage.
- Key Metrics Trends: Follow execution and usage trends over time to spot volatility, sudden drops, or abnormal spikes that may signal operational risk.
- Run Success Rate (Planned): Quantify stability to determine if an automation is ready for broader or higher-risk rollout.
- Failure Ranking Table (Planned): Isolate high-impact breakpoints to prioritize troubleshooting where it matters most.
The Accountability Layer: Cost & Consumption Breakdown
Observability must evolve into accountability. Raw usage data is less actionable without attribution. This view shifts the focus from passive monitoring to active cost management across budget health, cost centers, tools and models, and audit trends.
- Budget Health
- Cost Centers
- Tools & Models
- Audit Trends
Monitor operational continuity. Avoid service interruptions by tracking consumption velocity rather than just static balances. Review immediate burn rates to keep budgeting proactive.
- Credit Balance: Monitor remaining credits to maintain sufficient operational funds.
- Usage (last 7 days): Track recent trends to detect short-term consumption spikes.
- Estimated day(s) remaining: Project how long the current balance will last based on recent trends.
Scaling requires distinguishing high-value patterns from isolated experiments. Analyze adoption clusters across teams to decide which workflows to standardize and where to optimize spending.
- Usage by Bot/Workflow: Quantify how many credits and tokens each workflow consumes to determine if capital is fueling stable, high-value operations or ongoing experimentation (via the Production vs. Debugging split).
- Usage by Department: Compare total versus per-capita consumption to reveal the true financial footprint of different business lines so budgets reflect actual usage.
- Usage by Member: Pinpoint which users are driving the largest share of organizational spend by tracking total Credit consumption per member.
Cost structure is defined not just by volume, but by resource selection. This view shows transparency into the tools and models powering operations, allowing managers to understand the structural split between free/paid and utility/premium resources.
- System Tools: Audit consumption by tool category (Paid vs. Free) to verify internal usage and simplify reconciliation.
- Model Usage Breakdown: View the traffic split between high-cost and lower-cost options to determine the organization’s preference for the LLMs.
Cost governance requires auditability. Resolving variance demands a shift from aggregate trends to transaction-level proof. The Key Metrics Trends view combines broad patterns with a granular ledger to trace anomalies.
- Trend lines and ledger: Trend lines for Total Credits and Tokens, with Runs as additional execution context, plus a daily ledger for deep dives.
- Token details: Input vs. Output token details for closer inspection.
- Model-level consumption: Model-level consumption detail for auditing spend across models and queries.
The Control Layer: AI Usage Governance
Governance determines the velocity of safe adoption. Unregulated AI leads to shadow IT and data leaks. This layer defines the boundaries of AI adoption, empowering managers with robust control measures, shifting from "anything goes" to structured authorization across global controls, resource access, and organization & audit trails.
Global Controls
Set organization-wide defaults before teams create or publish anything. These controls reduce policy drift by standardizing privacy boundaries, admin delegation, and approved model choices.
| Control | What it governs |
|---|---|
| Allow Private Status | • Employees can create private resources (Flows, Bots, KBs) • Private resources are visible only to the creator • Alternatively: Assets can be set as open by default |
| Group Admin Rights | • Defines Group Admin permissions over member-owned resources • Supports centralized control models • Enables delegated governance within groups |
| Workspace Default Workflow | • Sets a vetted backend Workflow as the default assistant • Applies to Personal Chat within a Workspace • Employees start from an approved assistant rather than a raw model |
| Model Management | • Controls available LLMs: OpenAI, Azure, Gemini, self-hosted • Manages specific model versions • Aligns model usage with compliance policies • Enforces cost control policies |
Resource Access
Governance requires least-privilege execution, not blanket access. These controls define who can see, change, or run each capability, so collaboration stays open while sensitive logic and data remain protected.
| Control | What it governs |
|---|---|
| Workflows | • Manage: Full administrative control • Edit: Modify configuration and logic • View: Read-only access to details • Execute-Only: Run without exposing internal setup |
| Tools | • Manage: Full administrative control • Edit: Modify tool configuration • View: Read-only access • Usage: Can be used when building Agents or Flows |
| Agents | • Manage: Full administrative control • Edit: Modify prompt, knowledge, and configuration • View: Read-only access to Agent details |
| Knowledge Bases | • Governs ownership for each Knowledge Base • Controls access permissions • Applies to all organization-created KBs |
| Folder Permissions | • Defines folder-level access for KB content • Edit: Modify folder contents • View: Read-only access • Manage: Control access rules |
| Document Governance | • Reference Visibility: Read content but don't show in answers • Document Availability: Disable for retrieval without deletion • Controls how documents are used in AI responses |
| External Access Security | • Password protection for shared resources • IP allowlist restrictions • Domain allowlist controls • Secures externally accessible Bots and Flows |
| Quick Bots Access Control | • Manage: Full administrative control • Edit: Modify configuration (includes usage rights) • View: Read-only access • Usage: Who can use the Quick Bot |
| Quick Bots Configuration Governance | • Model selection control • Temperature setting management • Token distribution ratio (context vs. reply) • Ensures consistency and cost efficiency |
| Collaboration Workspaces Member Management | • Defines who can invite members • Controls who can remove members • Workspace Owner holds the highest authority |
| Collaboration Workspaces Access & Capability | • Separates participation from execution • Workspace access does not override resource permissions • Individual Flow/Agent/KB permissions remain enforced |
Organization & Audit Trails
Accountability depends on traceability across people, groups, and actions. These controls map governance to real organizational structure and provide audit evidence for reviews and incident investigation.
| Control | What it governs |
|---|---|
| Groups | • Maps organizational structure: Departments or Projects • Defines administration scopes • Allows Group Admins to manage resources within their scope |
| Members | • Manages user roles within the organization • Controls group assignments for accounts |
| Pending Members | • Gates the onboarding process • Allows invitations to be reviewed before activation • Supports re-sending or revoking invitations |
| Account Activity | • Provides a comprehensive audit log of all actions • Tracks: who did what, when, from where (Browser, IP) • Includes filtering and export for compliance review |